link: https://orlinbobchev.com/tools/stocksGrowth
Recently, I’ve decided to inspect all the growth that happened in 2024 and 2025 to find outliers and interesting cases that would allow me to brainstorm some ideas for 2026.
It turns out it’s harder and harder to get high-quality stock data, but there are still a few places where you can find good enough data, and with some cleaning, it can be usable for analysis.
Of course, most of the crazy returns are from highly speculative actions and biotech opportunities. We are talking 300%+. This is far away from the amazing 32% Nvidia return.
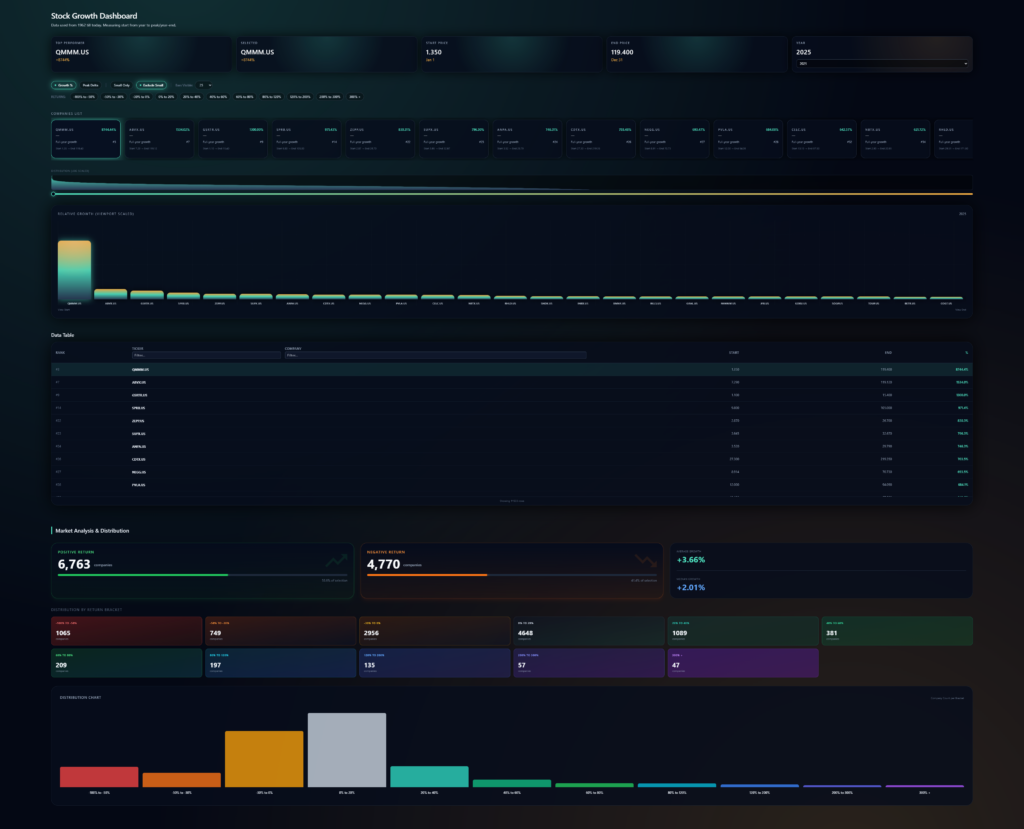
Some interesting stats:
Positive Returns
0% to 20%: 4,707 companies
20% to 40%: 1,139 companies
40% to 60%: 416 companies
60% to 80%: 235 companies
80% to 120%: 223 companies
120% to 200%: 172 companies
200% to 300%: 88 companies
300%+: 93 companies
I am mostly interested in distressed companies rebounding.
I’ve also tested the boundaries of ChatGPT 5.1 with this project, as my aim was not to write a single line of code while doing it. I am mostly happy with the result, but I needed to switch to the latest Google Gemini Pro 3 Preview, as ChatGPT couldn’t cope with the context window.
I definitely believe we should invest more in bigger context models instead of trying to make them more intelligent right now, meaning you would get a lot of value just by increasing the context window right now. (most people are experiencing this right now for development)
Anyway, feel free to give it a spin and ping me with ideas if you find anything interesting.
ps: I plan to analyse the top 100 companies, ping me if you are interested in the report.